Cloudwatch 
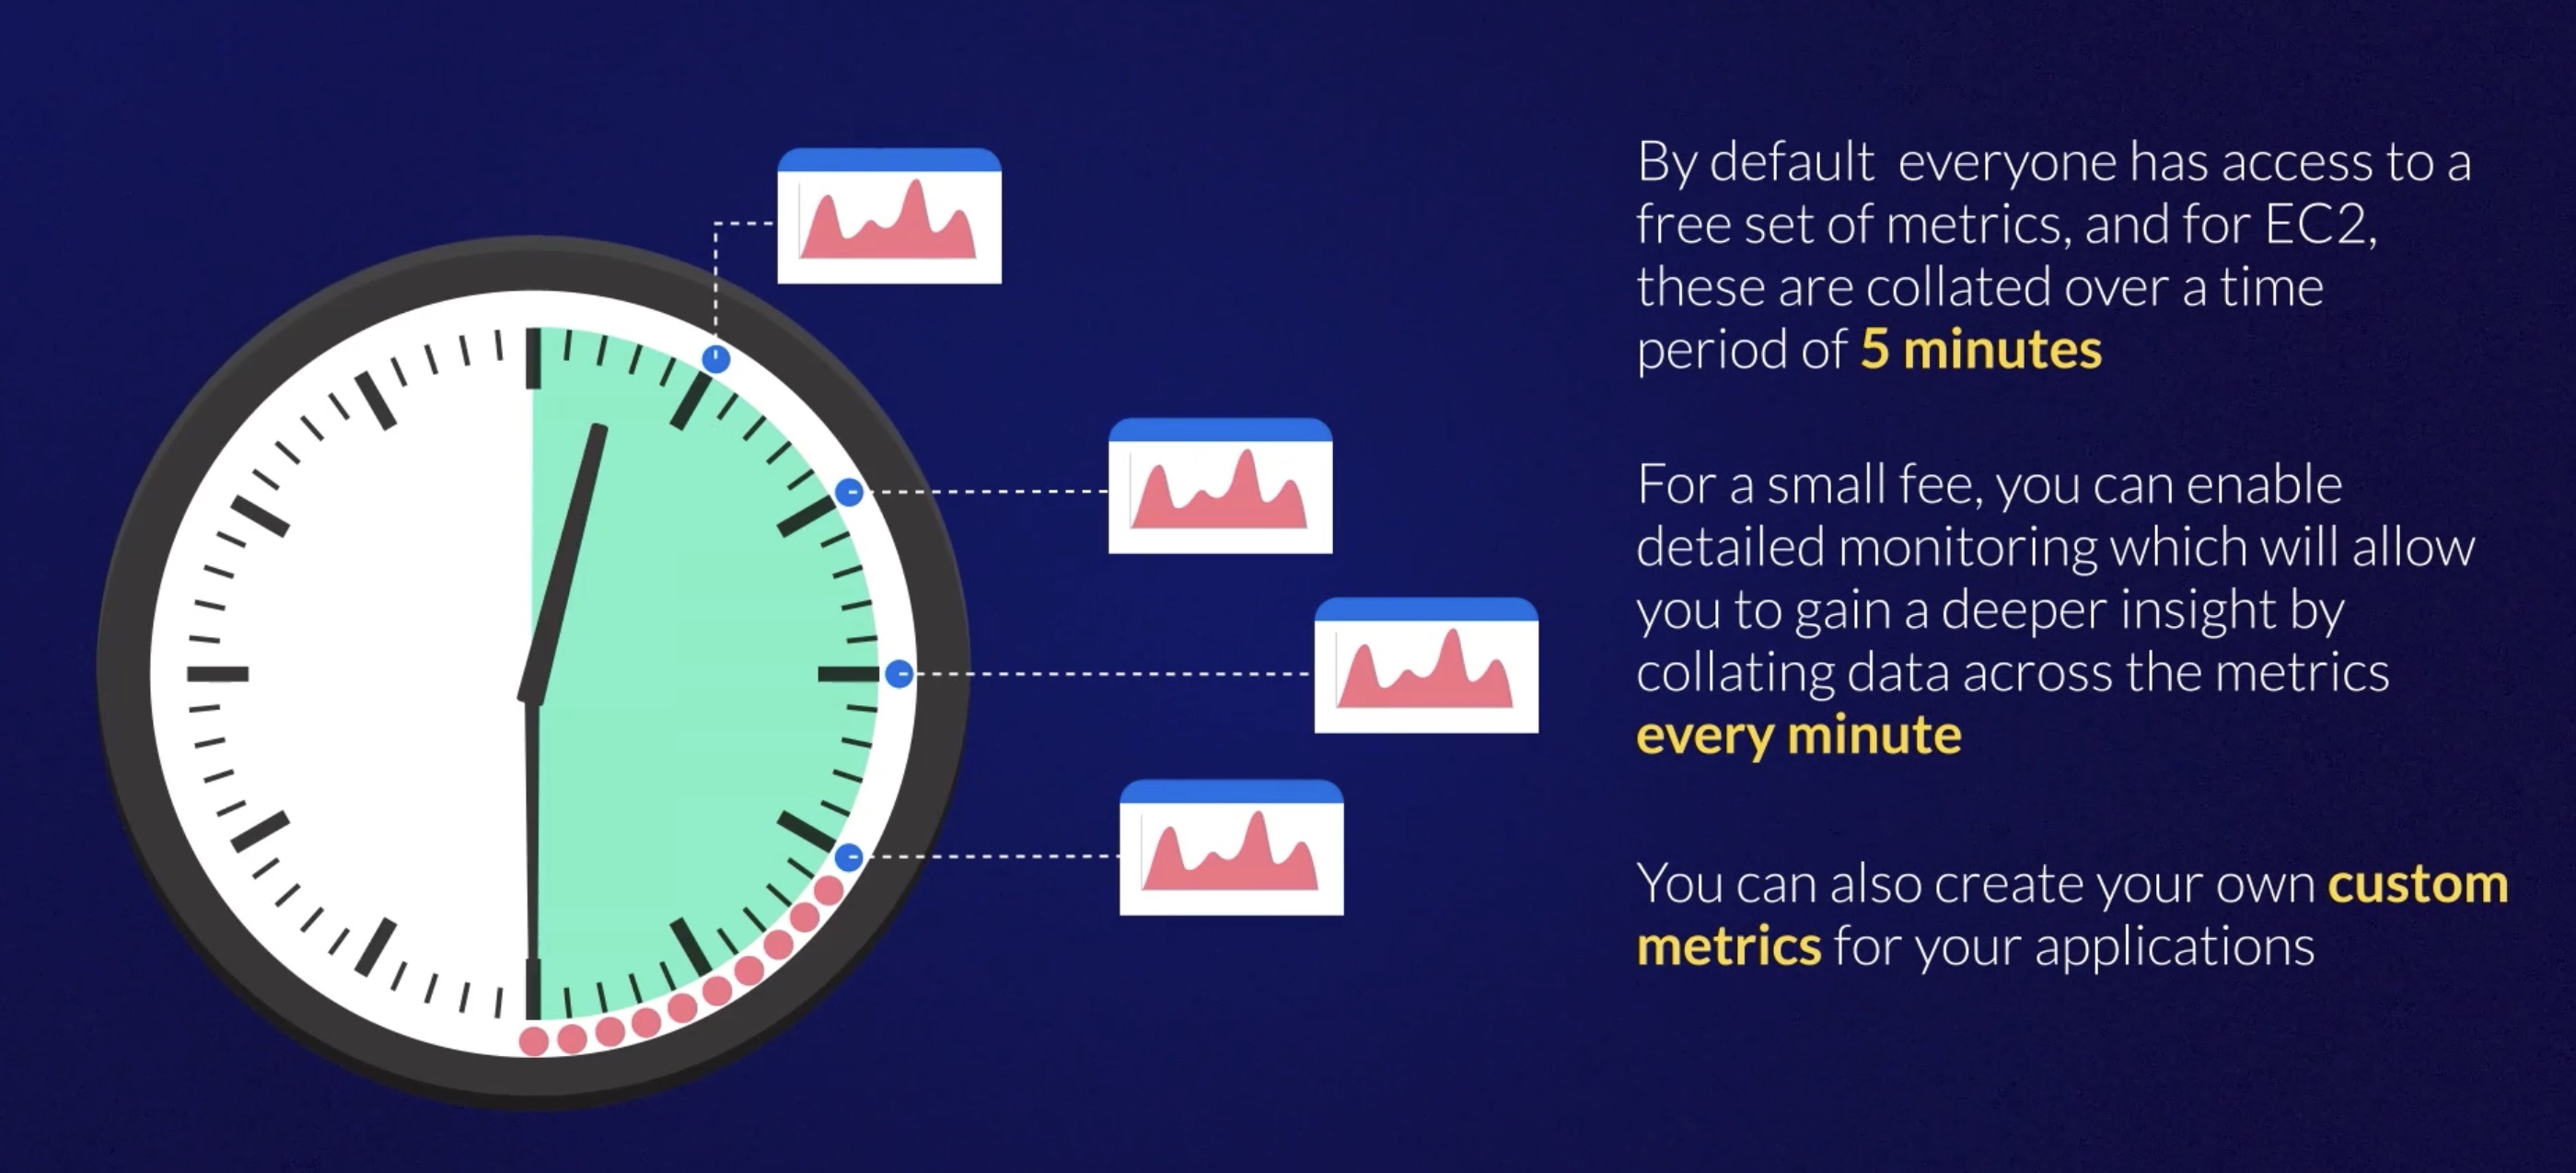
Cloudwatch monitors performance. Standard monitoring is 5 mins while detailed monitoring is 1 minute.
AWS services send metrics to CloudWatch. CloudWatch then uses these metrics to create graphs automatically that show how performance has changed over time.
Cloudwatch can monitor
- EC2
- Autoscaling groups
- Elastic Load Balancers
- Route 53 checks
- EBS
- CloudFront
CloudTrail and Cloudwatch difference?
CloudTrail is different from CloudWatch as it records what API calls are made to AWS management console and which actions are taken.
We can see who made the call, what was the IP, and when calls were made.
Concepts 📙
Namespaces 🪐
A namespace is a container for CloudWatch metrics. Metrics in different namespaces are isolated from each other, so that metrics from different applications are not mistakenly aggregated into the same statistics.
There is no default namespace. You must specify a namespace for each data point you publish to CloudWatch. You can specify a namespace name when you create a metric.
Dimentions ⌱
A dimension is a name/value pair that is part of the identity of a metric. You can assign up to 30 dimensions to a metric.
Every metric has specific characteristics that describe it, and you can think of dimensions as categories for those characteristics. Dimensions help you design a structure for your statistics plan. Because dime
Dimensions: Server=Prod, Domain=Frankfurt, Unit: Count, Timestamp: 2016-10-31T12:30:00Z, Value: 105
Dimensions: Server=Beta, Domain=Frankfurt, Unit: Count, Timestamp: 2016-10-31T12:31:00Z, Value: 115
Dimensions: Server=Prod, Domain=Rio,       Unit: Count, Timestamp: 2016-10-31T12:32:00Z, Value: 95
Dimensions: Server=Beta, Domain=Rio,       Unit: Count, Timestamp: 2016-10-31T12:33:00Z, Value: 97
Resolution ♾️
Each metric is one of the following:
- Standard resolution: with data having a one-minute granularity
- High resolution: with data at a granularity of one second
Metrics produced by AWS services are standard resolution by default. When you publish a custom metric, you can define it as either standard resolution or high resolution.
When you publish a high-resolution metric, CloudWatch stores it with a resolution of 1 second, and you can read and retrieve it with a period of 1 second, 5 seconds, 10 seconds, 30 seconds, or any multiple of 60 seconds.
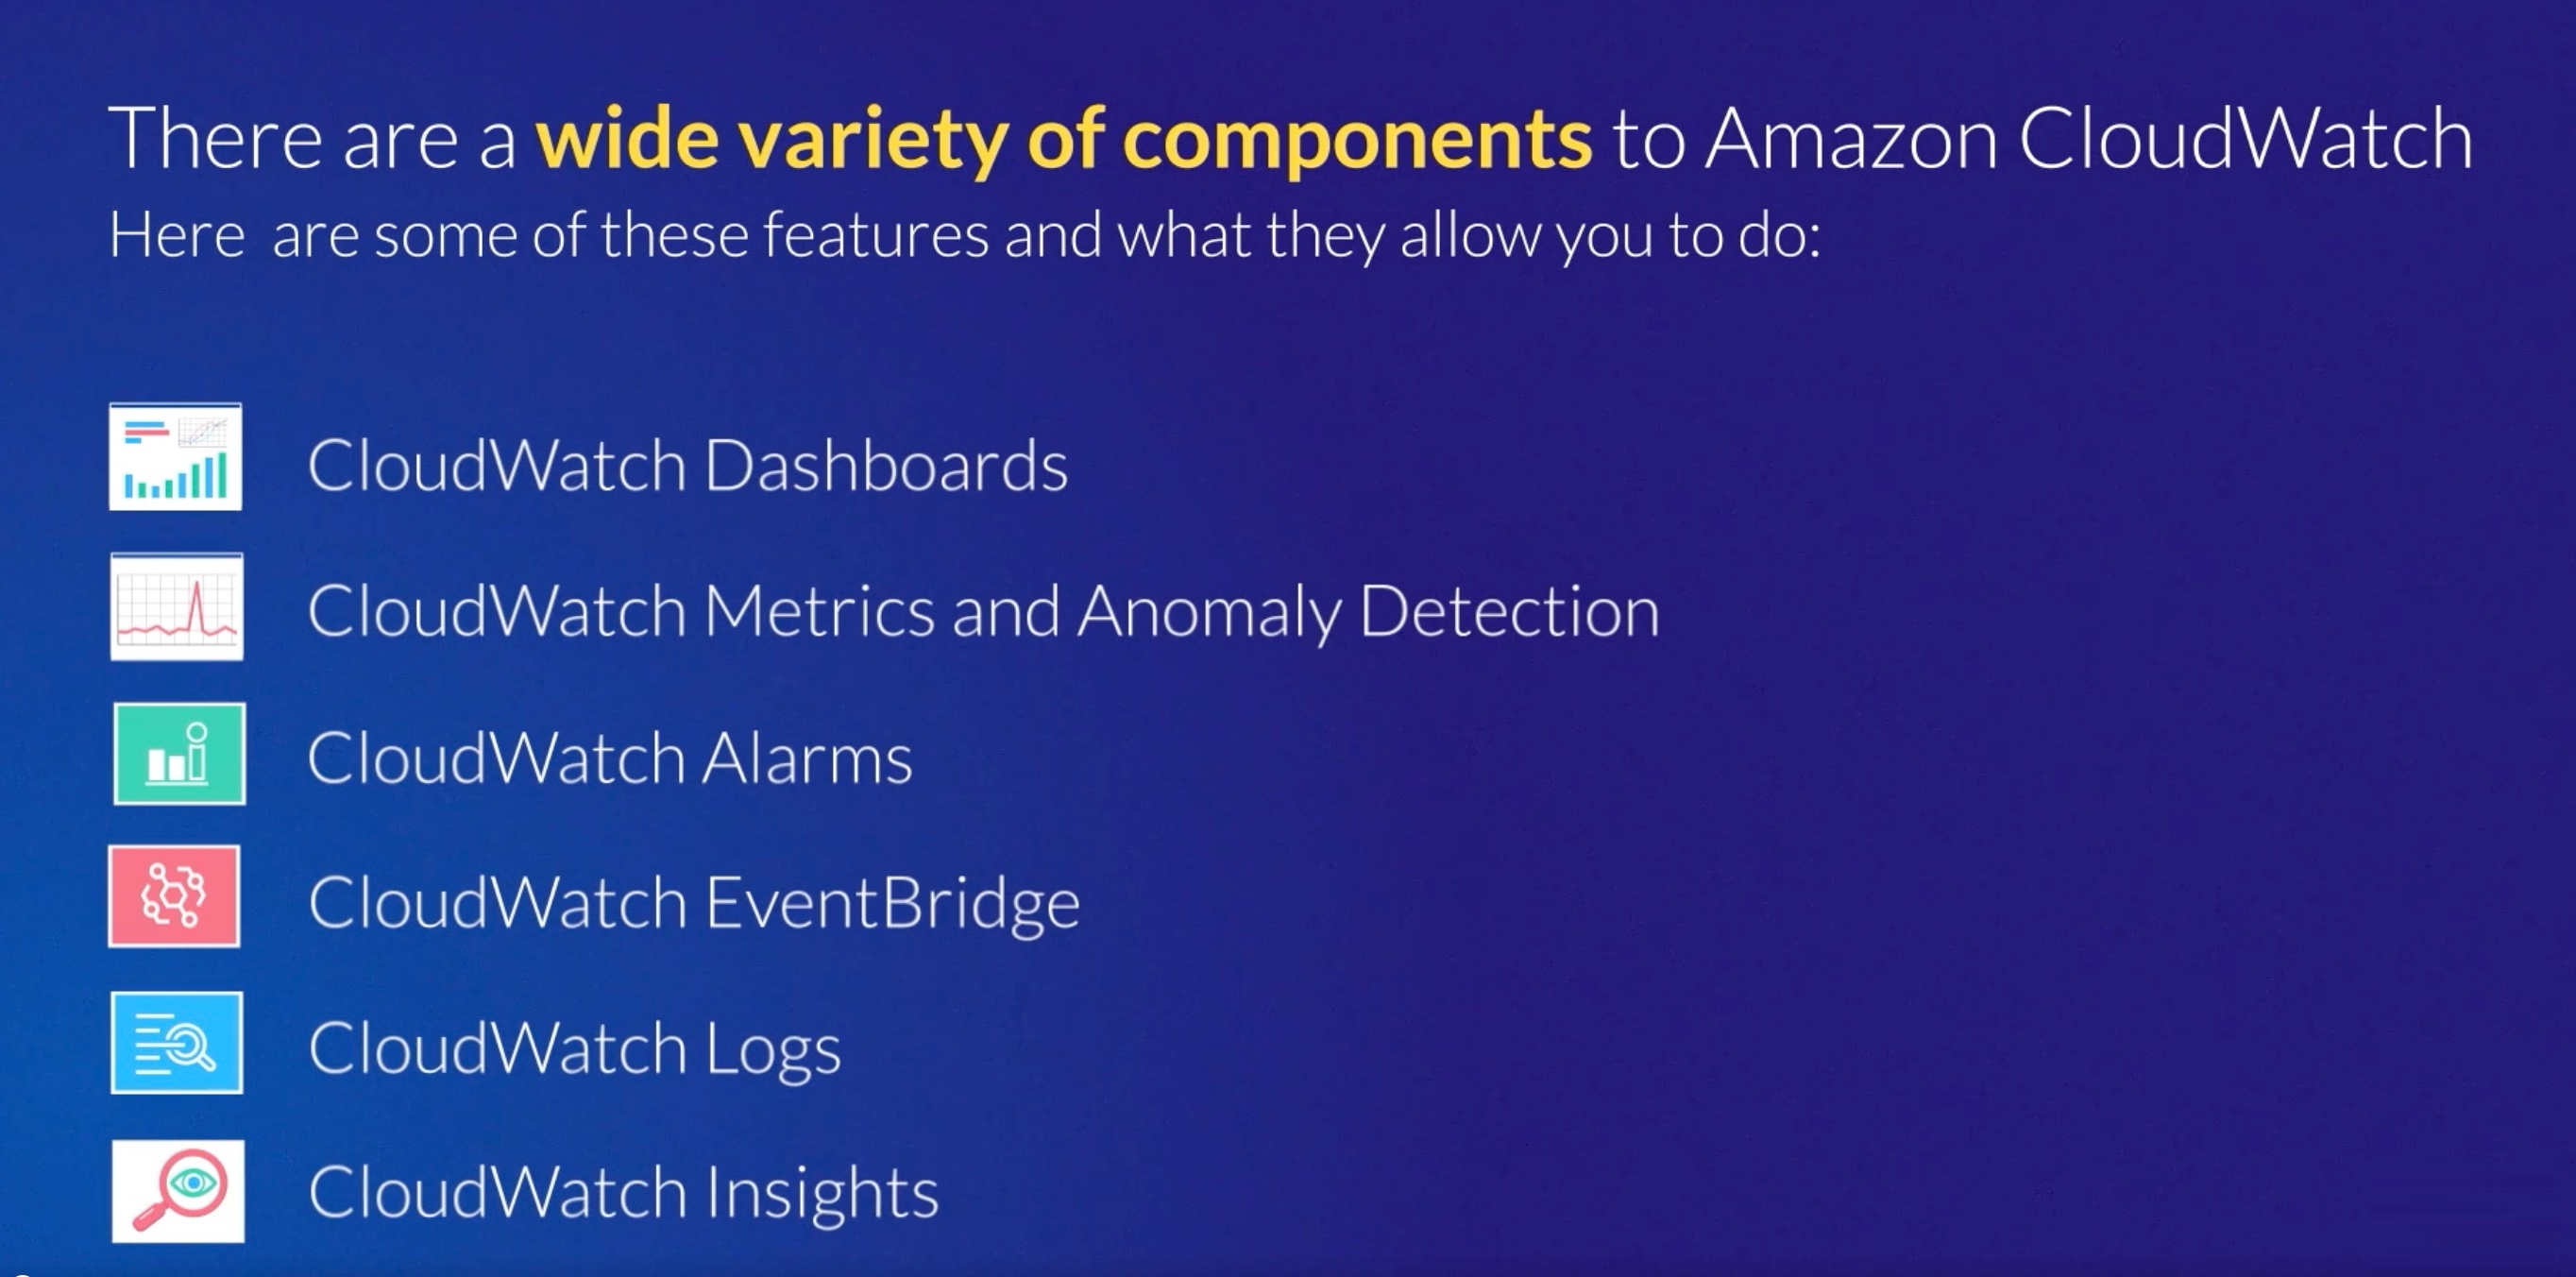
CloudWatch Alarms 🚨
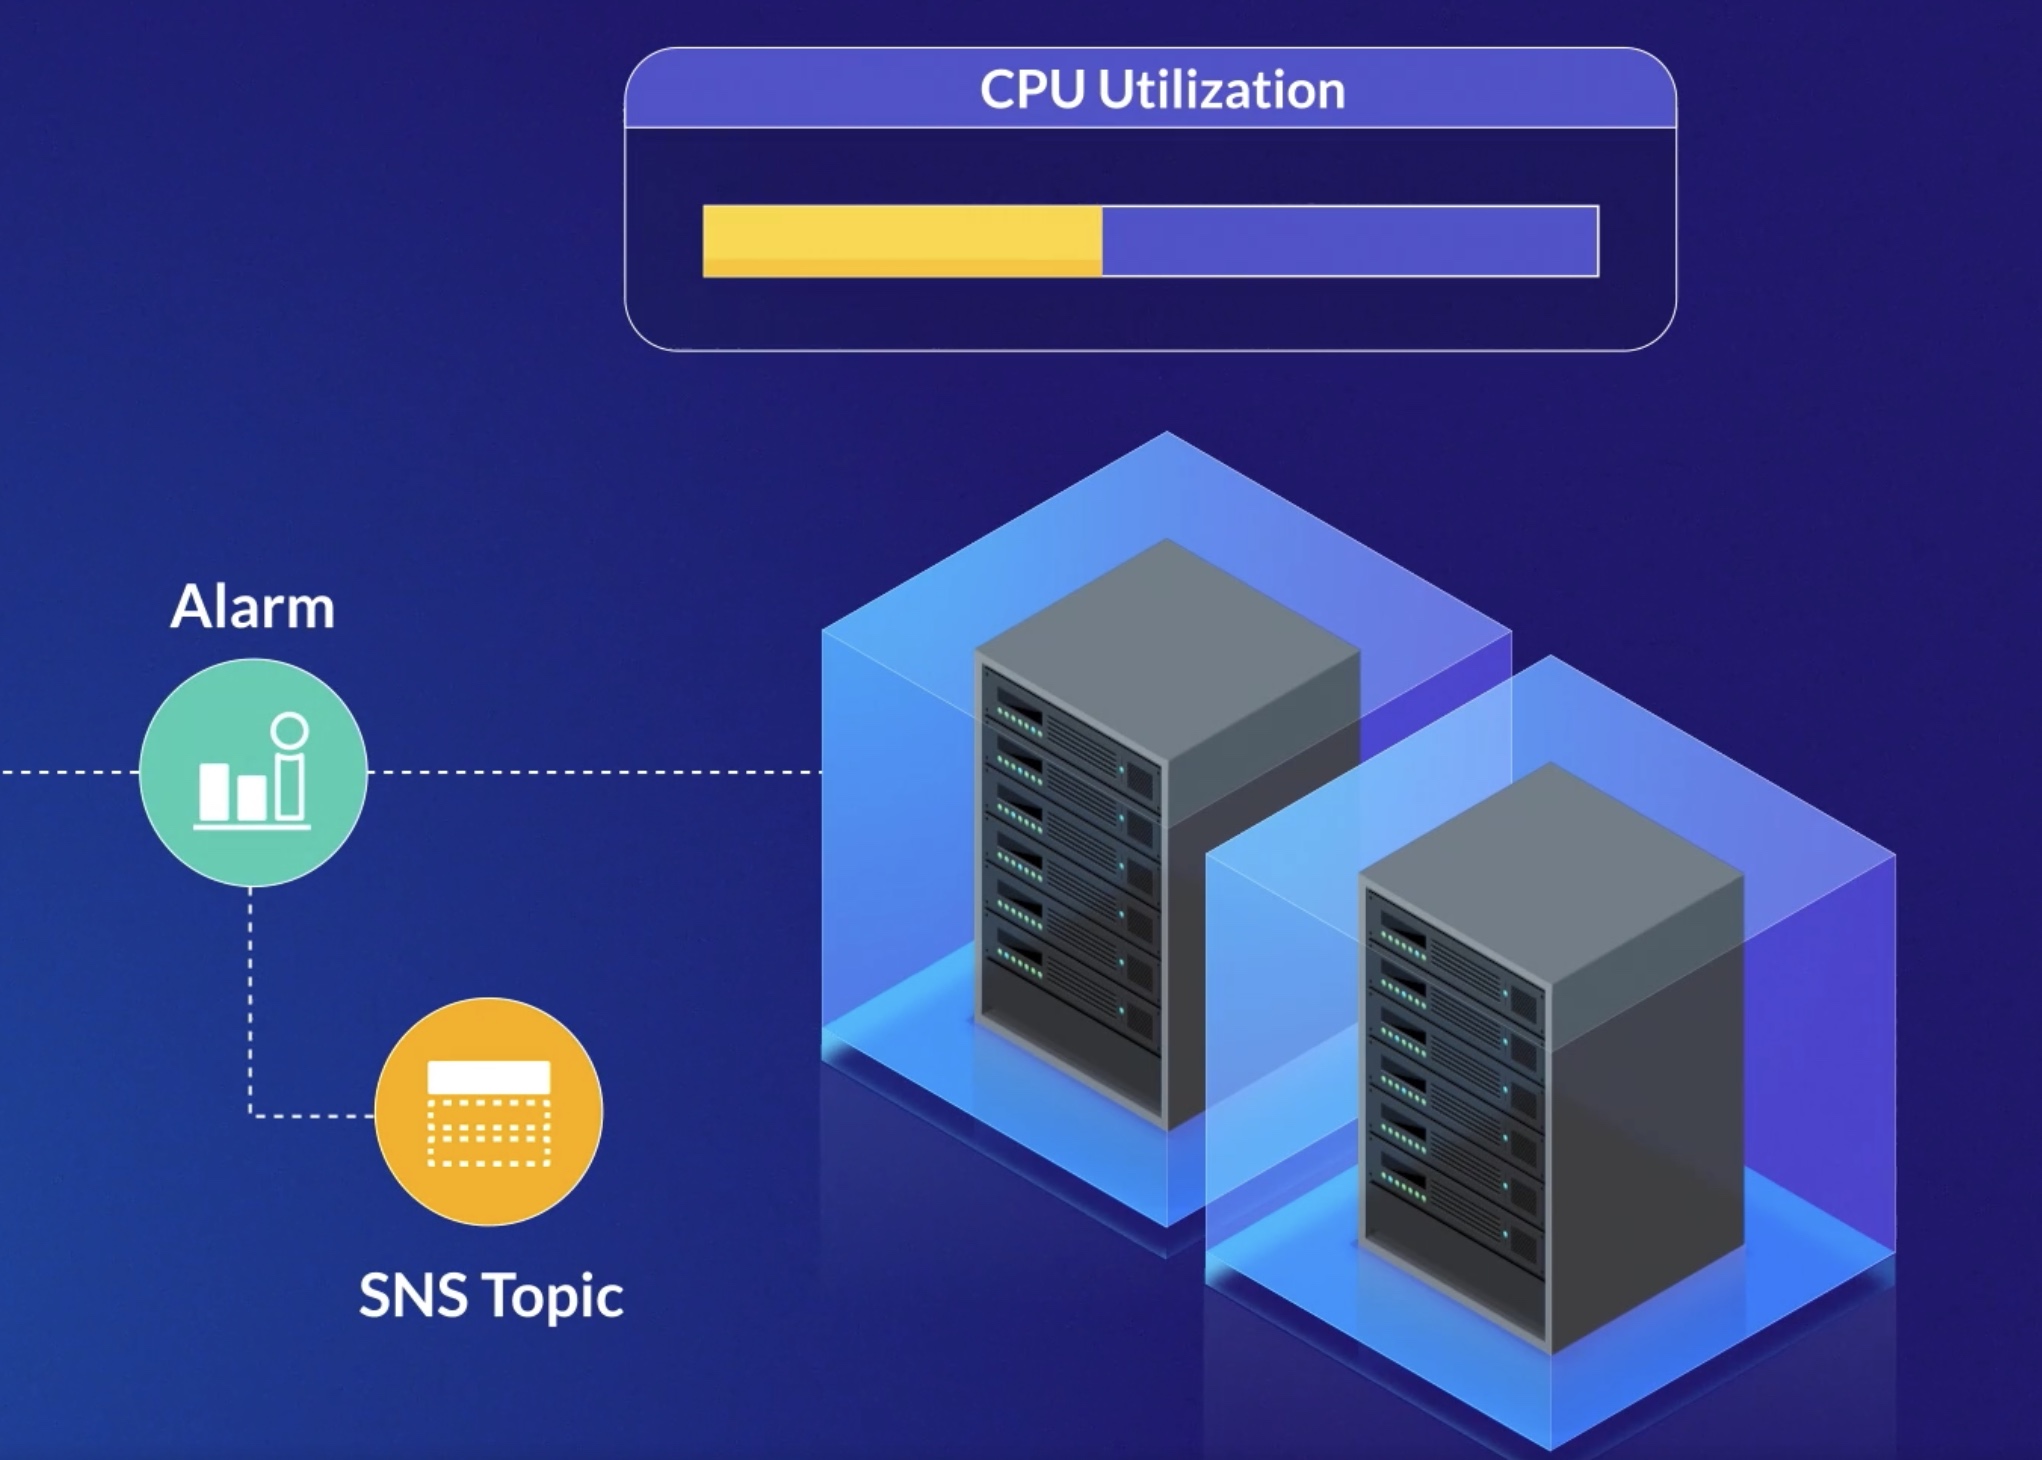
With CloudWatch, you can create alarms that automatically perform actions if the value of your metric has gone above or below a predefined threshold.
Save 💶 by using Alarms
For example, suppose that your company’s developers use Amazon EC2 instances for application development or testing purposes. If the developers occasionally forget to stop the instances, the instances will continue to run and incur charges.
In this scenario, you could create a CloudWatch alarm that automatically stops an Amazon EC2 instance when the CPU utilization percentage has remained below a certain threshold for a specified period. When configuring the alarm, you can specify to receive a notification whenever this alarm is triggered.
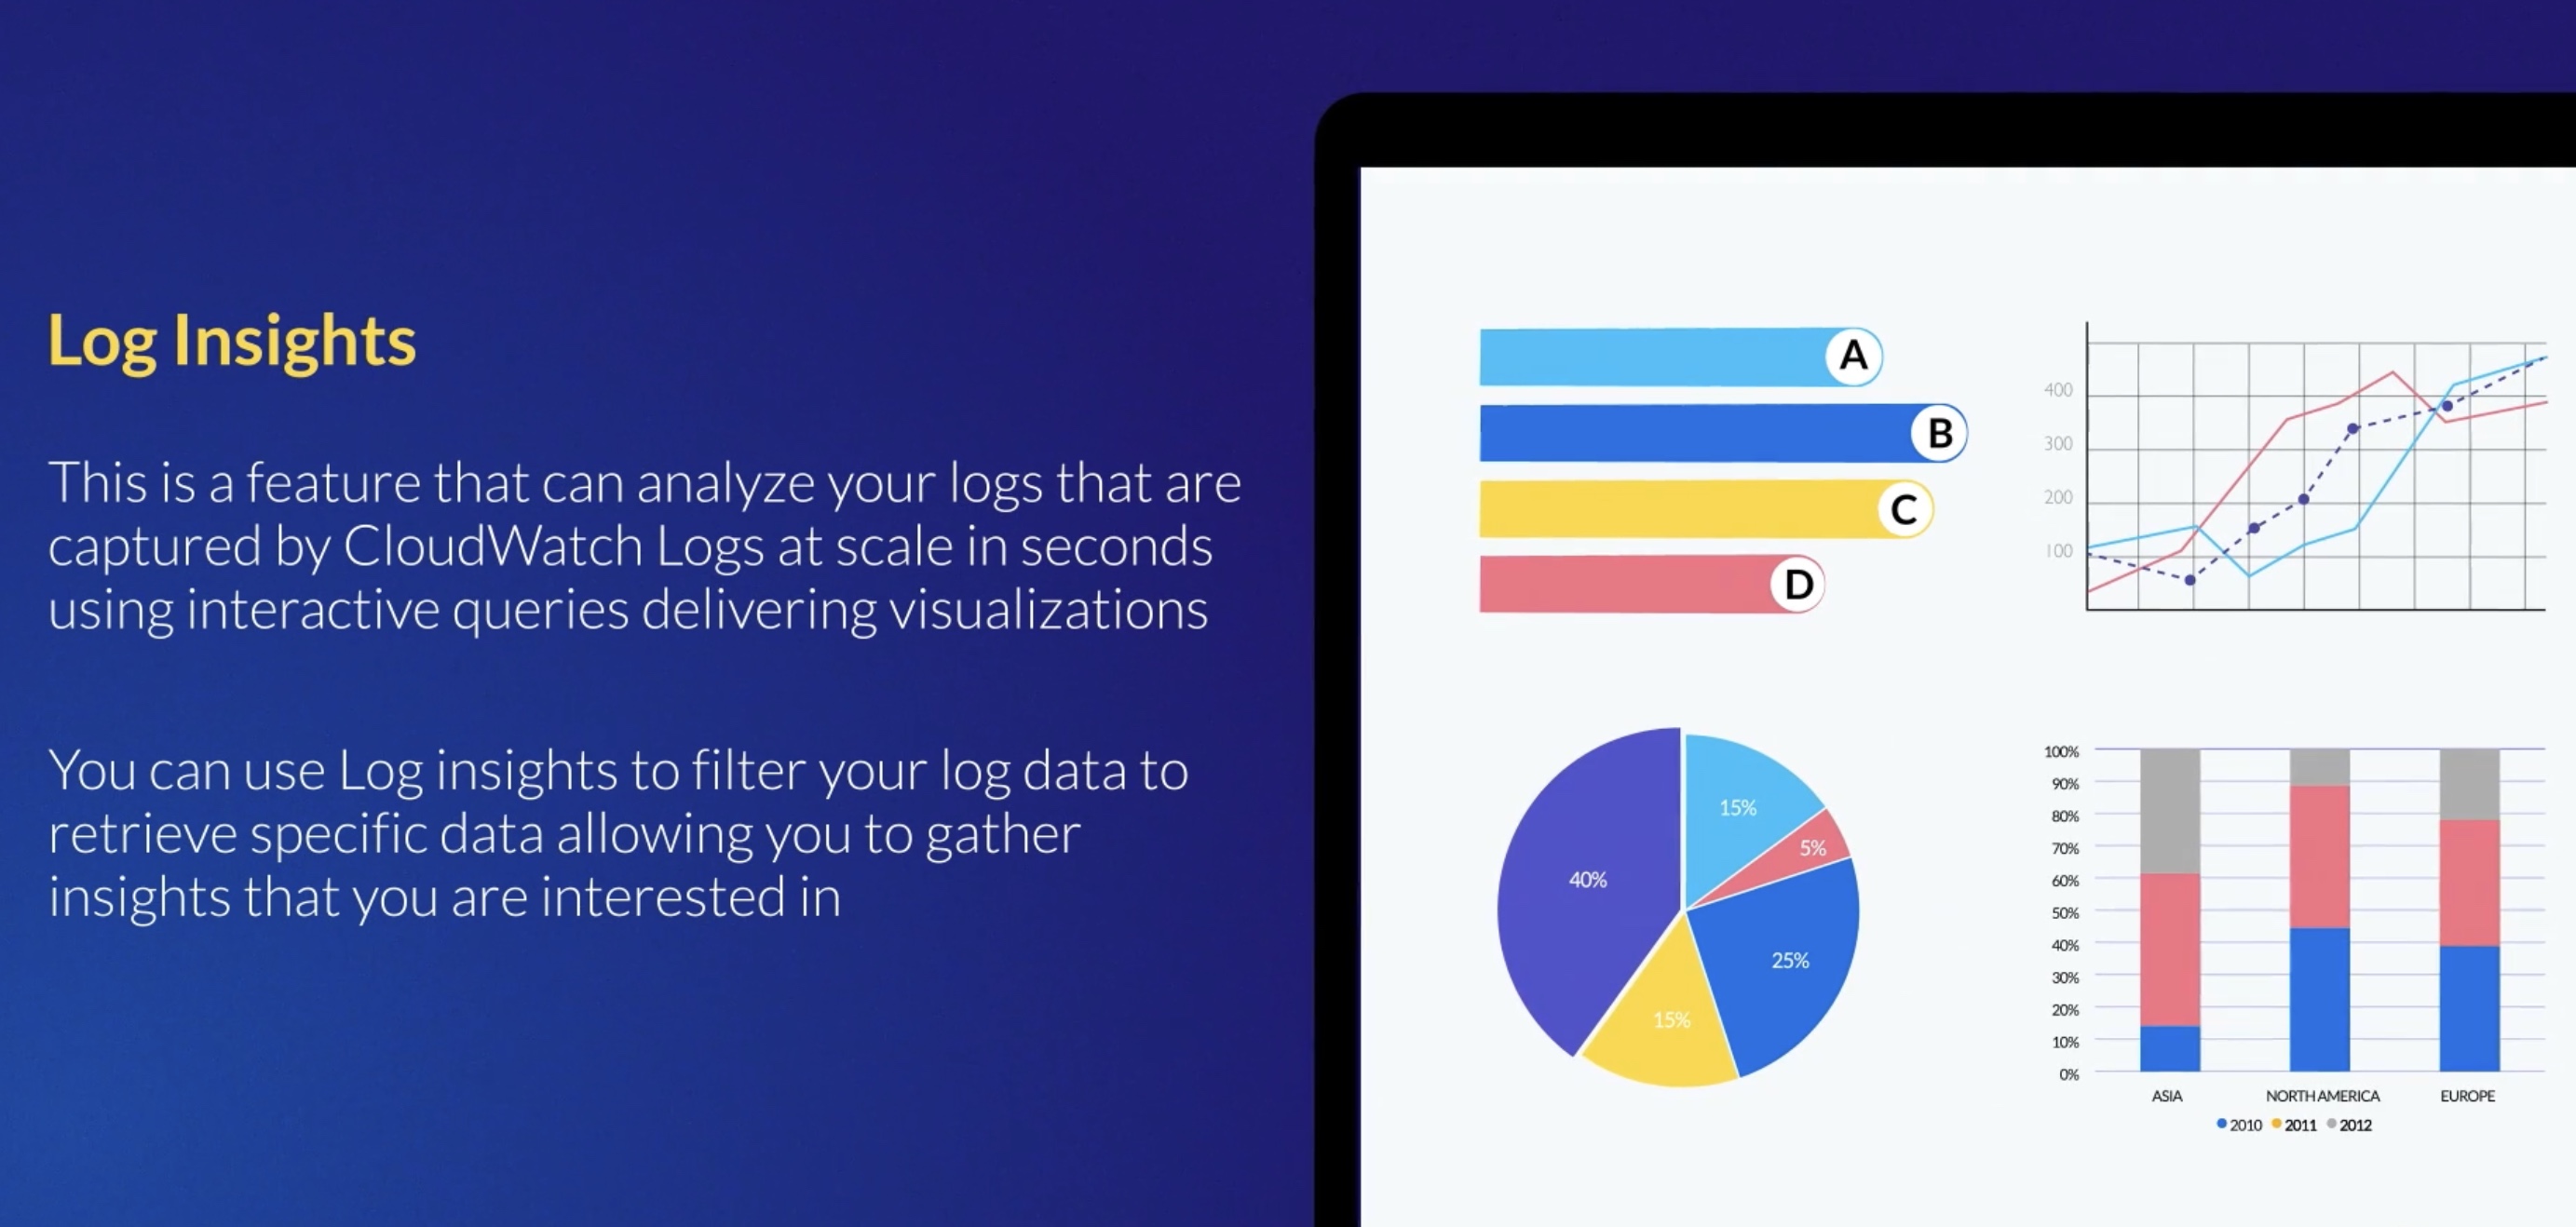
CloudWatch Logs Insights 💹
CloudWatch Logs Insights enables you to interactively query your log data in CloudWatch Logs. If a team wants to search and query their logs for their API, CloudWatch Logs Insights would be the best option.
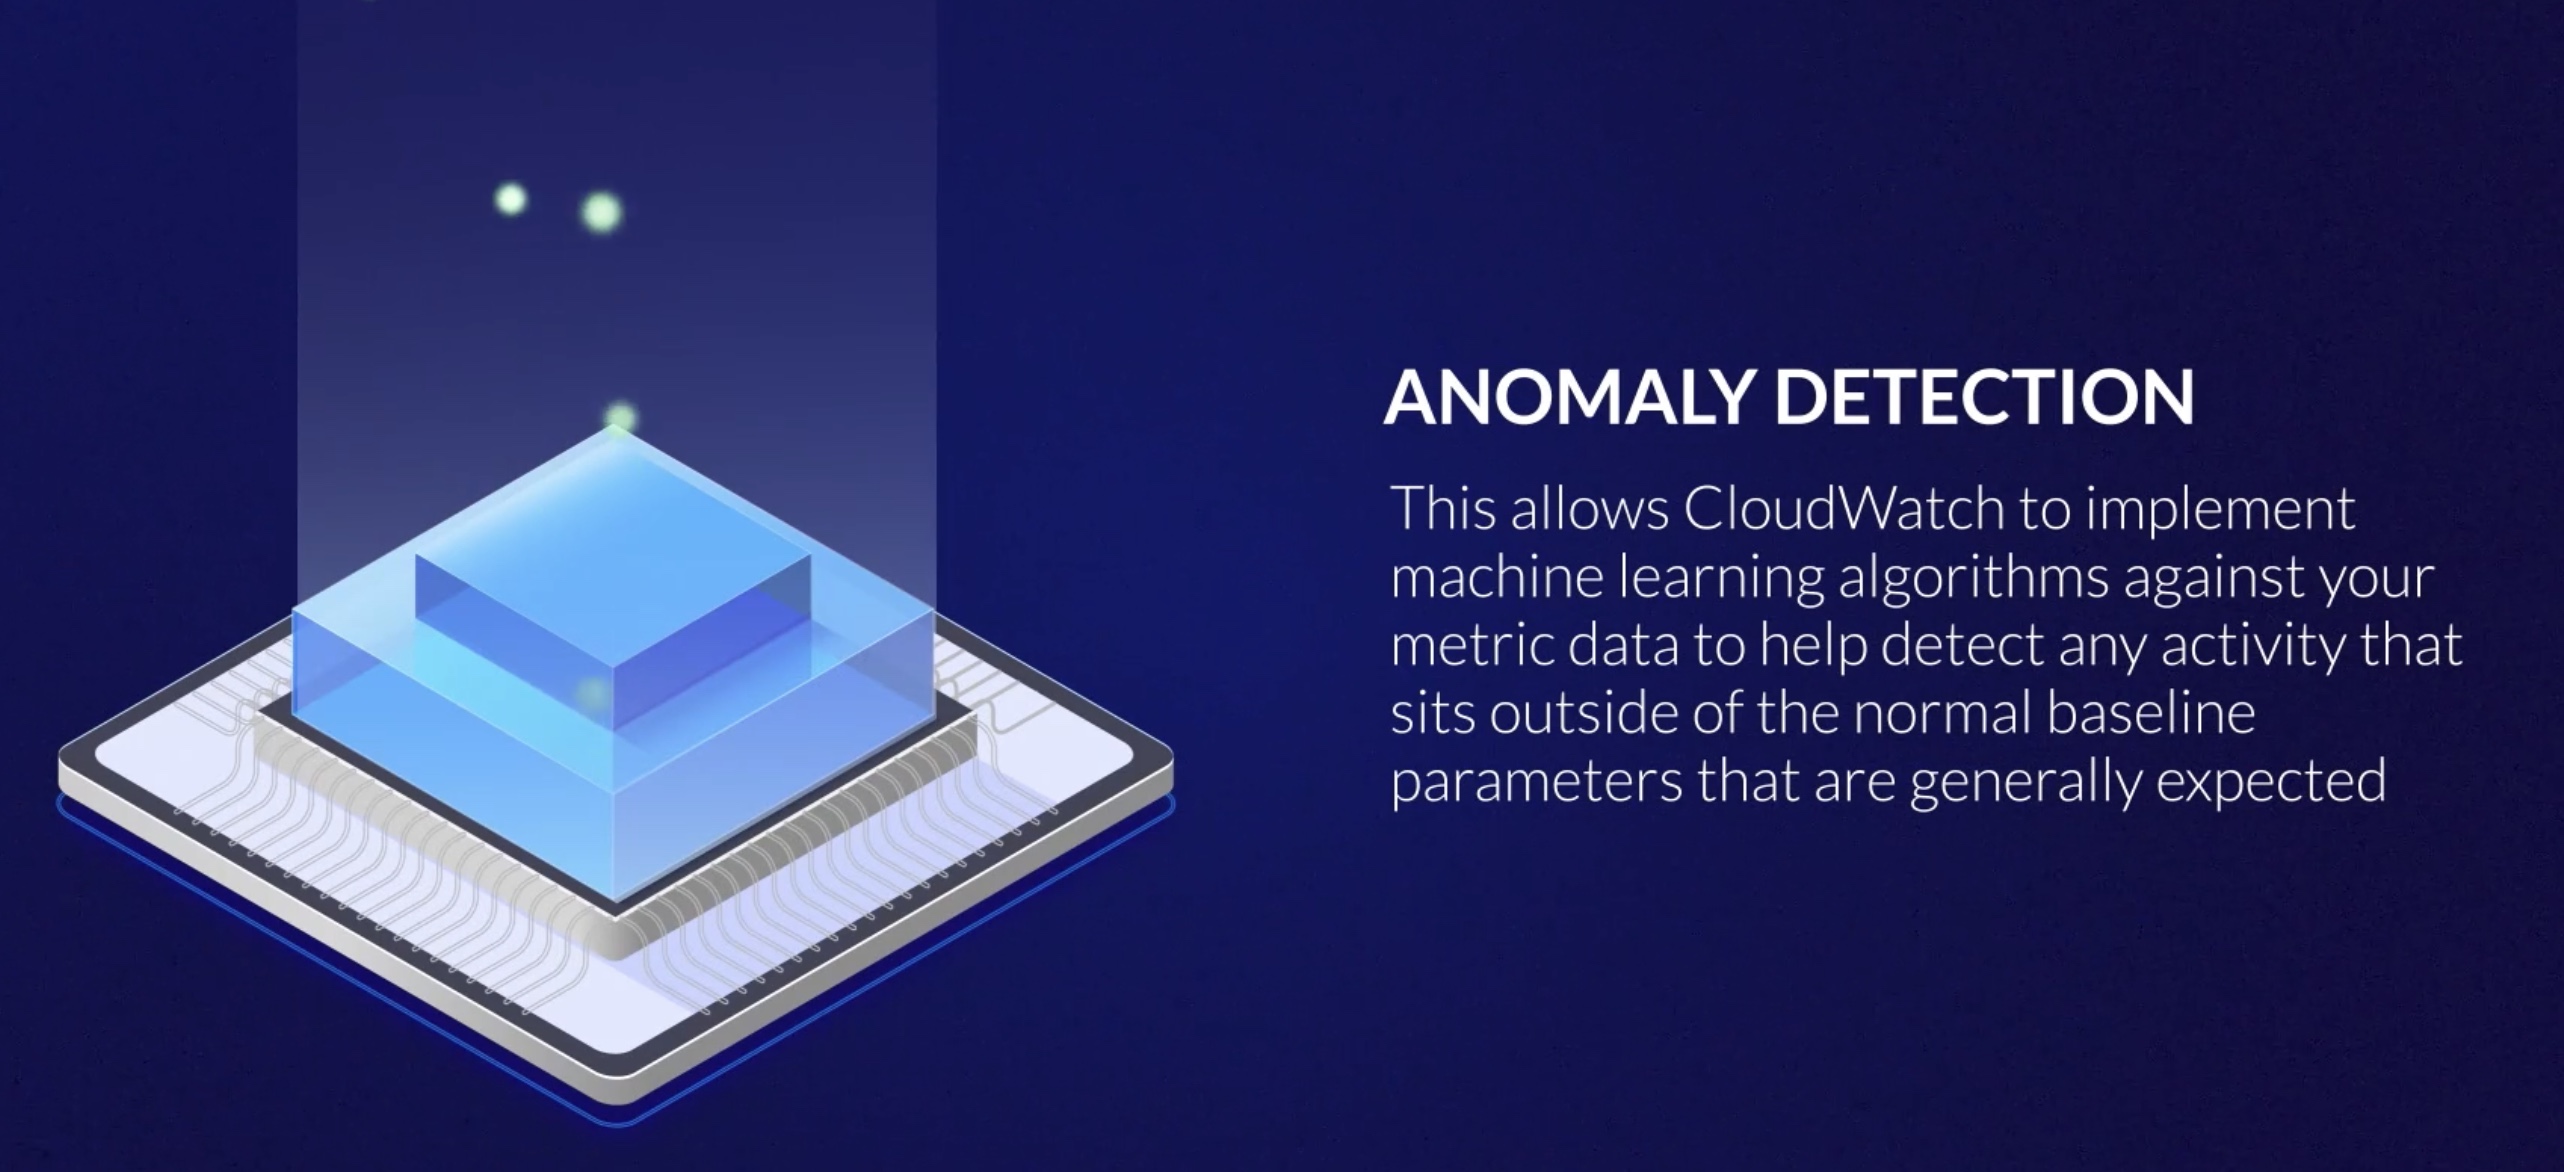
Anomaly Detection 🕵️